Introducing Radar: find translation errors in languages you don't read
Measure translation quality with built-in and custom measurements, build reports on the results, and pull the same data into your AI assistant through MCP to build your own charts.
Radar checks the quality of your translations, scores them, and explains each error it finds. You can follow those results in reports and charts, in Radar or in the AI assistant you already use.
Measure translation quality #
You can measure translation quality in two ways: with built-in measurements or with your own. Every result comes with its reasoning, so you can understand an error without reading the language.
Built-in measurements #
Lingo.dev provides these built-in measurements, ready to use:
- MQM finds translation errors and marks the exact words, the error category and its severity, then turns them into a score from 0 to 100.
- Glossary adherence checks that a translation uses the terms from your engine's glossary.
- Rule adherence checks that a translation follows your engine's rules.
- Edit rate shows how often people change a translation after it's delivered.
- Edit distance shows how much they change it.
To use one, open Radar → Measurements, turn the measurement on, and choose the languages, engines and share of translations it checks.
Custom measurements #
A custom measurement checks a requirement specific to your content, written in plain language. For example, "Product names stay in English" or "The translation keeps the same level of certainty as the source." To set one up:
- Open Radar → Measurements and select New measurement.
- Describe the requirement, and say what should pass and what should fail.
- Choose whether the answer is Pass or fail or a score from 0 to 100.
- Choose the languages it checks, then select Create measurement.
Open any result in Logs to see the source, the translation and the explanation behind it.
Track quality over time with reports #
With Radar's reports, you can see how quality changes over time and where it differs, for example which language's MQM score dropped this month, or which repository follows the glossary least. Save a report to share it with your team.
Radar → Overview gives you this month's activity and score trend.
- Open Radar → Explore, select New report, and pick a measurement. Radar shows its weekly results for the last 90 days.
- Break the results down by language, engine or source to compare them.
- Pick the chart that fits the question.
- Select Save report. Everyone in your organization can open it with current data or download it as a CSV.
Choose the chart that fits the question #
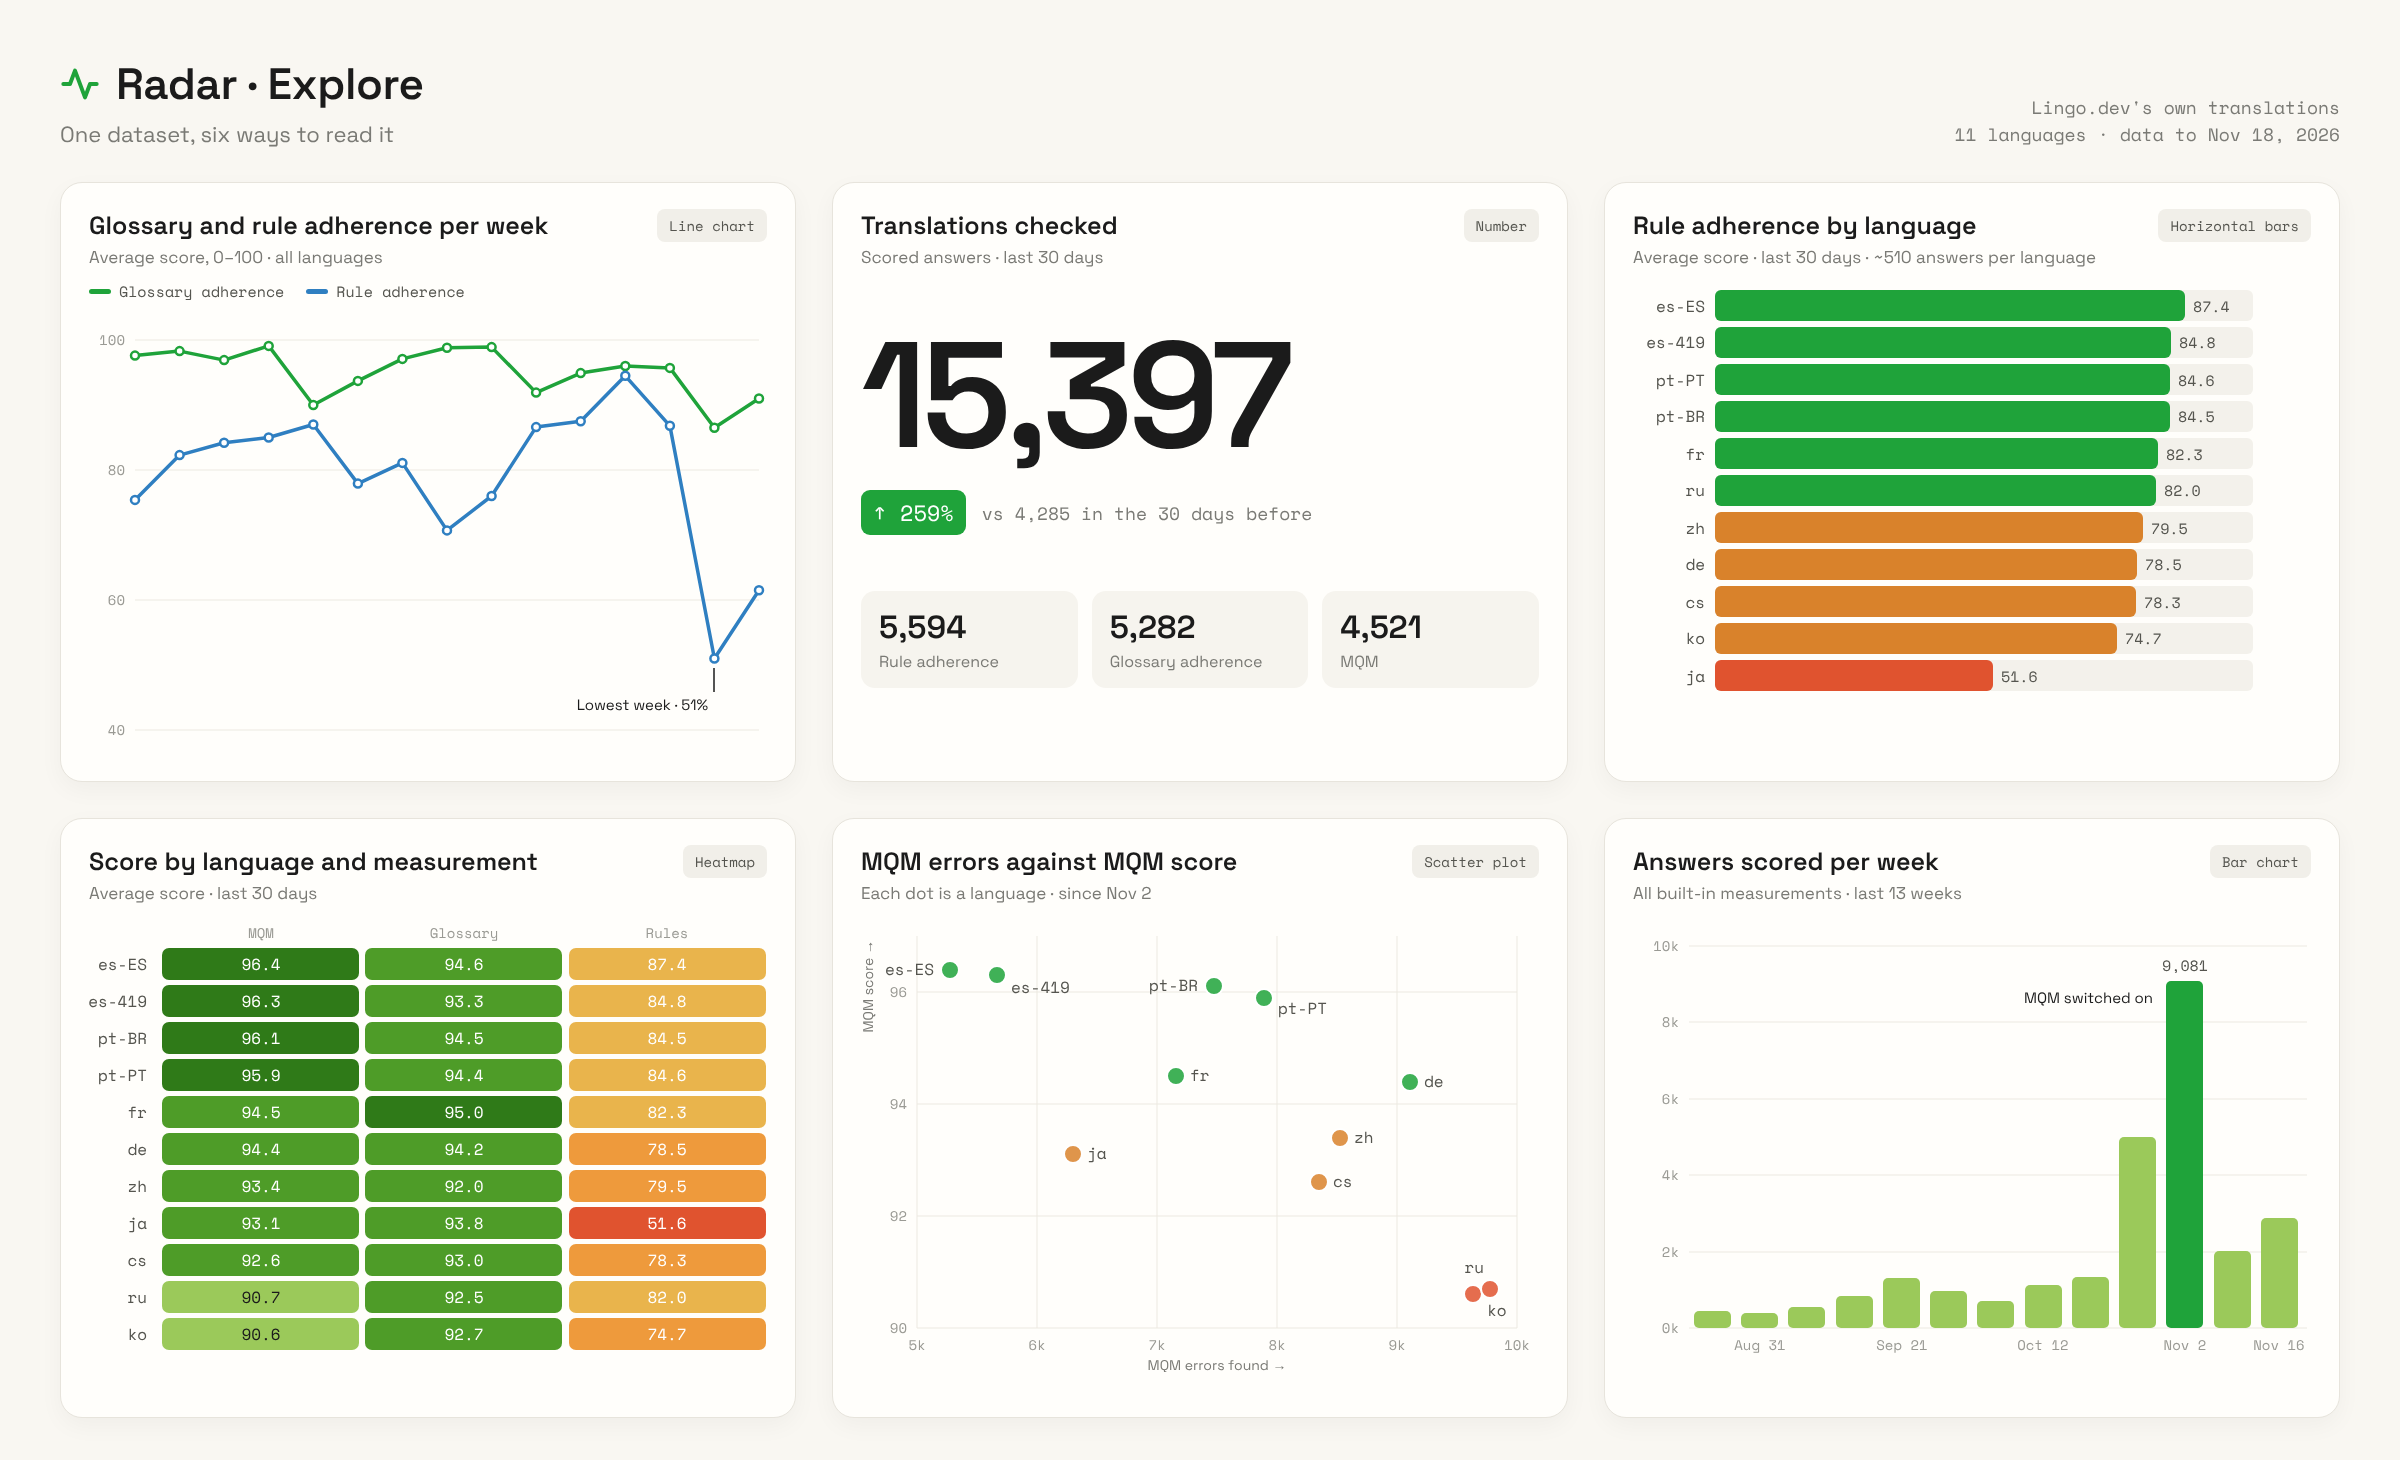
Explore draws the same data in different ways, depending on what you want to see:
- Line chart: how a score or volume changes over time.
- Bar chart: how totals compare from week to week or month to month.
- Number: one figure for the whole period, compared with the period before.
- Horizontal bars and pie chart: which languages, engines or measurements account for the most.
- Heatmap: how quality varies across two dimensions, such as language and measurement.
- Scatter plot: volume against quality, to find the busy languages that score lowest.
- Dot plot: passed against failed answers, side by side for each language.
To start from a ready-made chart, open Radar → Explore → Examples. Each example is drawn from your data, and you can adjust it and save it as your own report.
Build your own charts with your AI assistant #
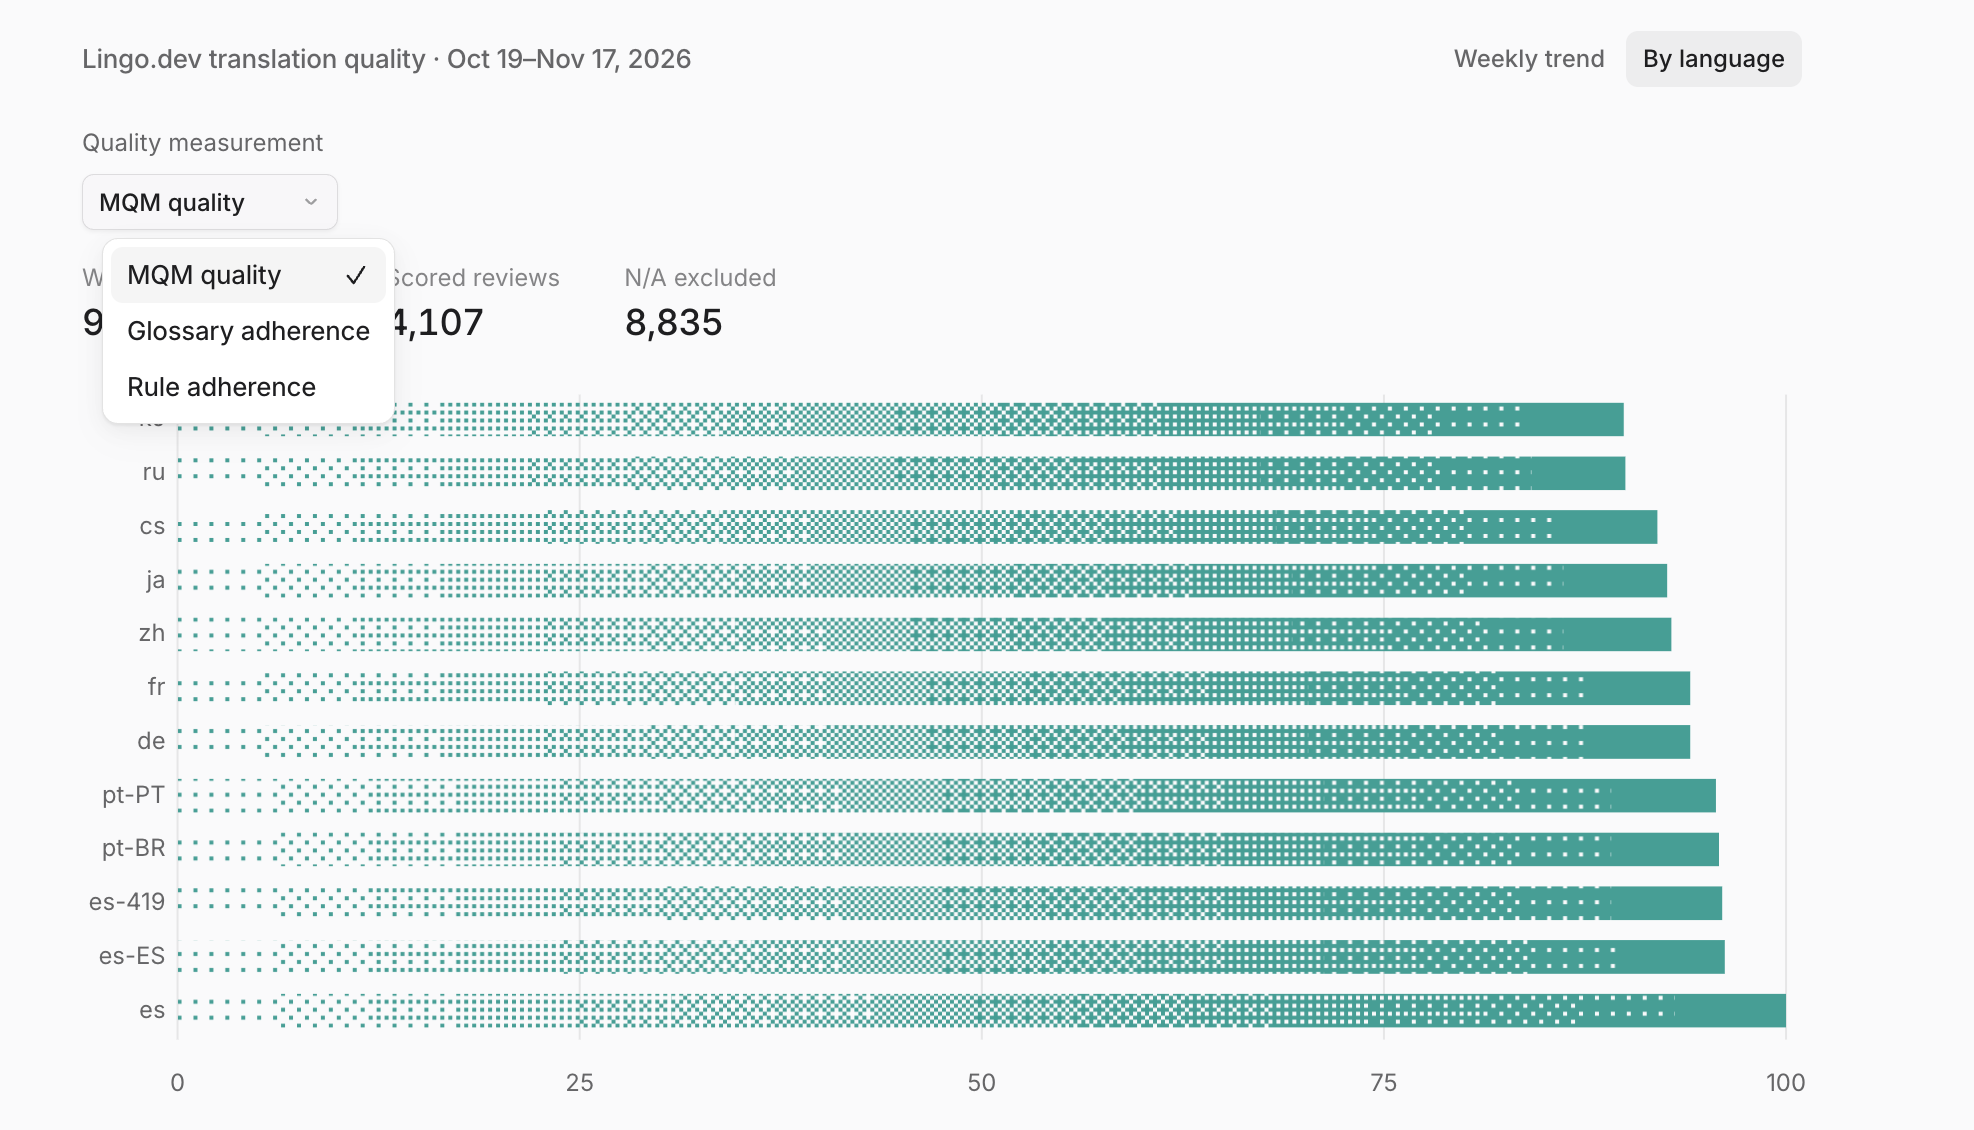
Your Radar data isn't limited to the dashboard. Connect the Lingo.dev MCP server to Claude, Cursor or another MCP client, and your assistant queries the same results by language, engine, model and repository. Ask a question, and it can answer with an interactive chart in the conversation. For example:
Chart our MQM scores by language for the last month, and let me switch between MQM, glossary adherence and rule adherence.
Measurements and their results are available on every plan. Reports, and report queries through MCP, are available on the Enterprise plan.